As I’ve mentioned on a couple of occasions, I attended Coaching Conference 2013 put on by Volleyball England at the start of June. Part of the presentation was on the current state of coaching in the country and the breakdown of certification levels. I’ve now got the slides from the presentation, so I can show you some of what I found interesting – and some of what I was questioned about when I talked with people regarding it afterwards.
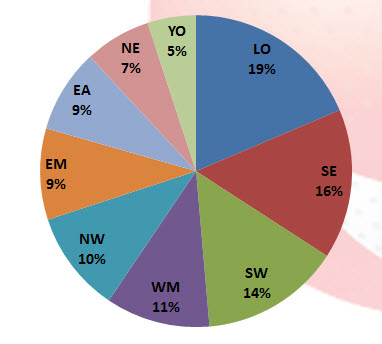
First, let me start of with a graph which shows the fraction of volleyball coaches registered with Volleyball England by region.

It’s interesting that the South West has the third most registered coaches. That tells me we have sufficient numbers in the area to do some interesting things if we get properly organized and motivated.
Here is a chart which shows the Volleyball England coaching registrations and the number of coaches at each certification level going back to the start of 2009.
There’s clearly been some nice growth in the total number of volleyball coaches in England – or at least those registering with the national governing body. The first level certifications are up, though not quite at the same rate (I think you need to combine the UKCC Level 1 and VE Level 1 to get the proper tally as I think the UKCC has taken over for that level). Level 2 coaches had a bit of a dip, but have turned back up. I think Volleyball England will be concerned if they don’t see that line get back to the same kind of upslope seen from 2009 to 2011.
As for the nearly flat line for Level 3 coaches, we were told that’s a function of Volleyball England not running the course very often. Obviously, there’s truth in that, but part of our discussions during the conference was the motivation for volleyball coaches to progress to that level. After all, at this stage it is not mandatory for anything. Plus, the course runs a week and has a pretty sizable price tag (I’ll report my own opinions on the course after I take it in August)
Here is a chart based on a survey Volleyball England did. I understand it to indicate the proportion of responding volleyball coaches who said they coach at each of the three age groups.
 To me there’s a problem with this chart. I think ideally we’d probably want to see the u14 bar highest and the adult bar lowest. More realistically, though, we should look for the 15-18 bar being higher than the adult one. I would venture to say that is what you’d see in the US where there are thousands of high school and Juniors club volleyball teams (especially for girls), but only perhaps a bit north of 1000 collegiate programs and relatively few coached adult club teams. I think it’s the middle area where the work needs to be done to really grow the sport.
Lastly, here’s the slide showing the coach development pathway the Volleyball England folks see (click it for a bigger version):

If you look at the levels of play/coaching listed on the left and see how they line up with the coaching certification levels you’ll quickly realize that things are very different today – at least in the middling and lower ranks. For example, I’m pretty sure the majority of NVL coaches aren’t VE Level 3 certified. This speaks to what I mentioned before about the motivation of coaches to carry on up the levels. Unless a minimum certification is required to coach at a given level, there is probably going to continue to be the same sort of pattern as we see in the levels chart above.
I’d be very curious to hear what others think on this subject.
