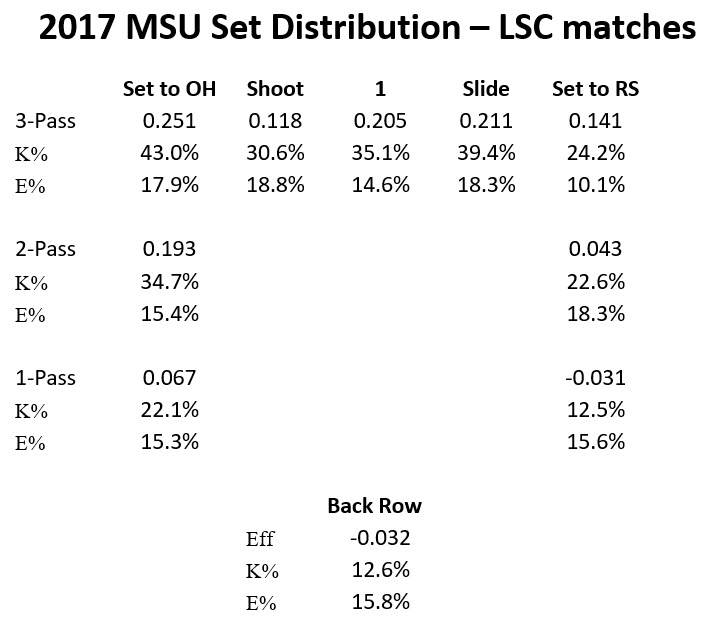
In this previous post I shared some offensive and defensive numbers for the 2017 Midwestern State season. Part of what we shared with the team was the table below. It breaks our offensive performance down by set location/type and pass quality. This ties in with the concepts mentioned here.
For the sake of clarity, let me explain the table.
The column labelled “Set to OH” includes any sets to the OH, including high balls, go’s, and 3s. For visual reference, those are the 4, hut, and 3/Rip on this set diagram (relatively few of the latter). They are broken down by pass or dig quality using the 3-point grading system. The first line for each group is Hitting Efficency, which is (Kills – Errors) / Total Attempts. The second and third lines are Kill % and Error % respectively. Basically, that just breaks the Hitting Efficiency number into its component parts.
I followed the same process for the right side attacks (“Set to RS”). For the middle and back row attacks, however, I did not use the pass rating splits. In the latter case there just weren’t enough observations to make it matter, especially since we did not have a focused back row attack. They were mainly out-of-system swings, which is probably pretty easy to guess from the poor numbers.
Collecting this information is relatively simple, if you have someone dedicated to doing so. I did it myself on the bench during matches using pen and paper. It would have been much more efficient and easier to manage if we had something like DataVolley, but we didn’t. So we made do.
Analysis
As a staff we were quite surprised by some of the numbers above. For example, we would not have predicted that slides were our most efficient middle hitter attack. It was something that really ran hot and cold. It would go from unstoppable to you can’t buy a kill. No doubt the latter skewed our perceptions. That’s a real risk, which is why stats are so important for good analysis.
The other surprising thing was the effectiveness of our in-system outside sets, especially compared to our middle attacks. You expect middles to generally go for a higher Kill % than pin hitters. That was clearly not the case for us. Even worse, our middles had a higher Error % in places. One reason for the high OH effectiveness on the good passes and digs is that we did a good job running the Shoot-Go combination. That gave our OHs some really good, open swings.
The anemic performance of our RS attack came as no surprise. We had a tall player in that position who was a blocking force, but just didn’t generate the power in her swings she needed to be really effective in our conference. Plus, her confidence wasn’t very high, so she wasn’t as aggressive as she really needed to be.
Putting it to use
The MSU attack just didn’t produce kills at a high enough rate. The table above let us identify the specific areas where improvement was needed. The right side was near the top of the list.
The second big thing was the middle attack. The error rates for Slides and Shoots were too high, which was likely a combination of poor attacking and poor sets. The error rate for 1s was more reasonable, but the Kill % was relatively low. That should have been north of 40% for a team like ours.
Address those two parts of our game, while keeping our OHs performing at about the same level, and we would be a very competitive team in our conference.
